This guide explains how IntelliMate can show diagrams in AI-generated responses and how they can help you understand ideas, processes, and relationships more clearly.
1. What diagrams are for
Sometimes a visual explanation is easier to understand than a long paragraph. Diagrams can help you see structure, steps, decisions, and connections at a glance.
In IntelliMate, diagrams can appear directly inside the chat so you can review them without switching to another tool.
2. What this means in IntelliMate
IntelliMate can show diagrams directly inside AI responses instead of explaining everything only in plain text.
This can make it easier to understand workflows, decisions, timelines, and relationships between people, ideas, or systems.
Diagram support is especially useful when you ask IntelliMate to explain a process, compare steps, map out ideas, or show how things connect.
3. Common diagram types
IntelliMate can show many commonly used diagram types, including:
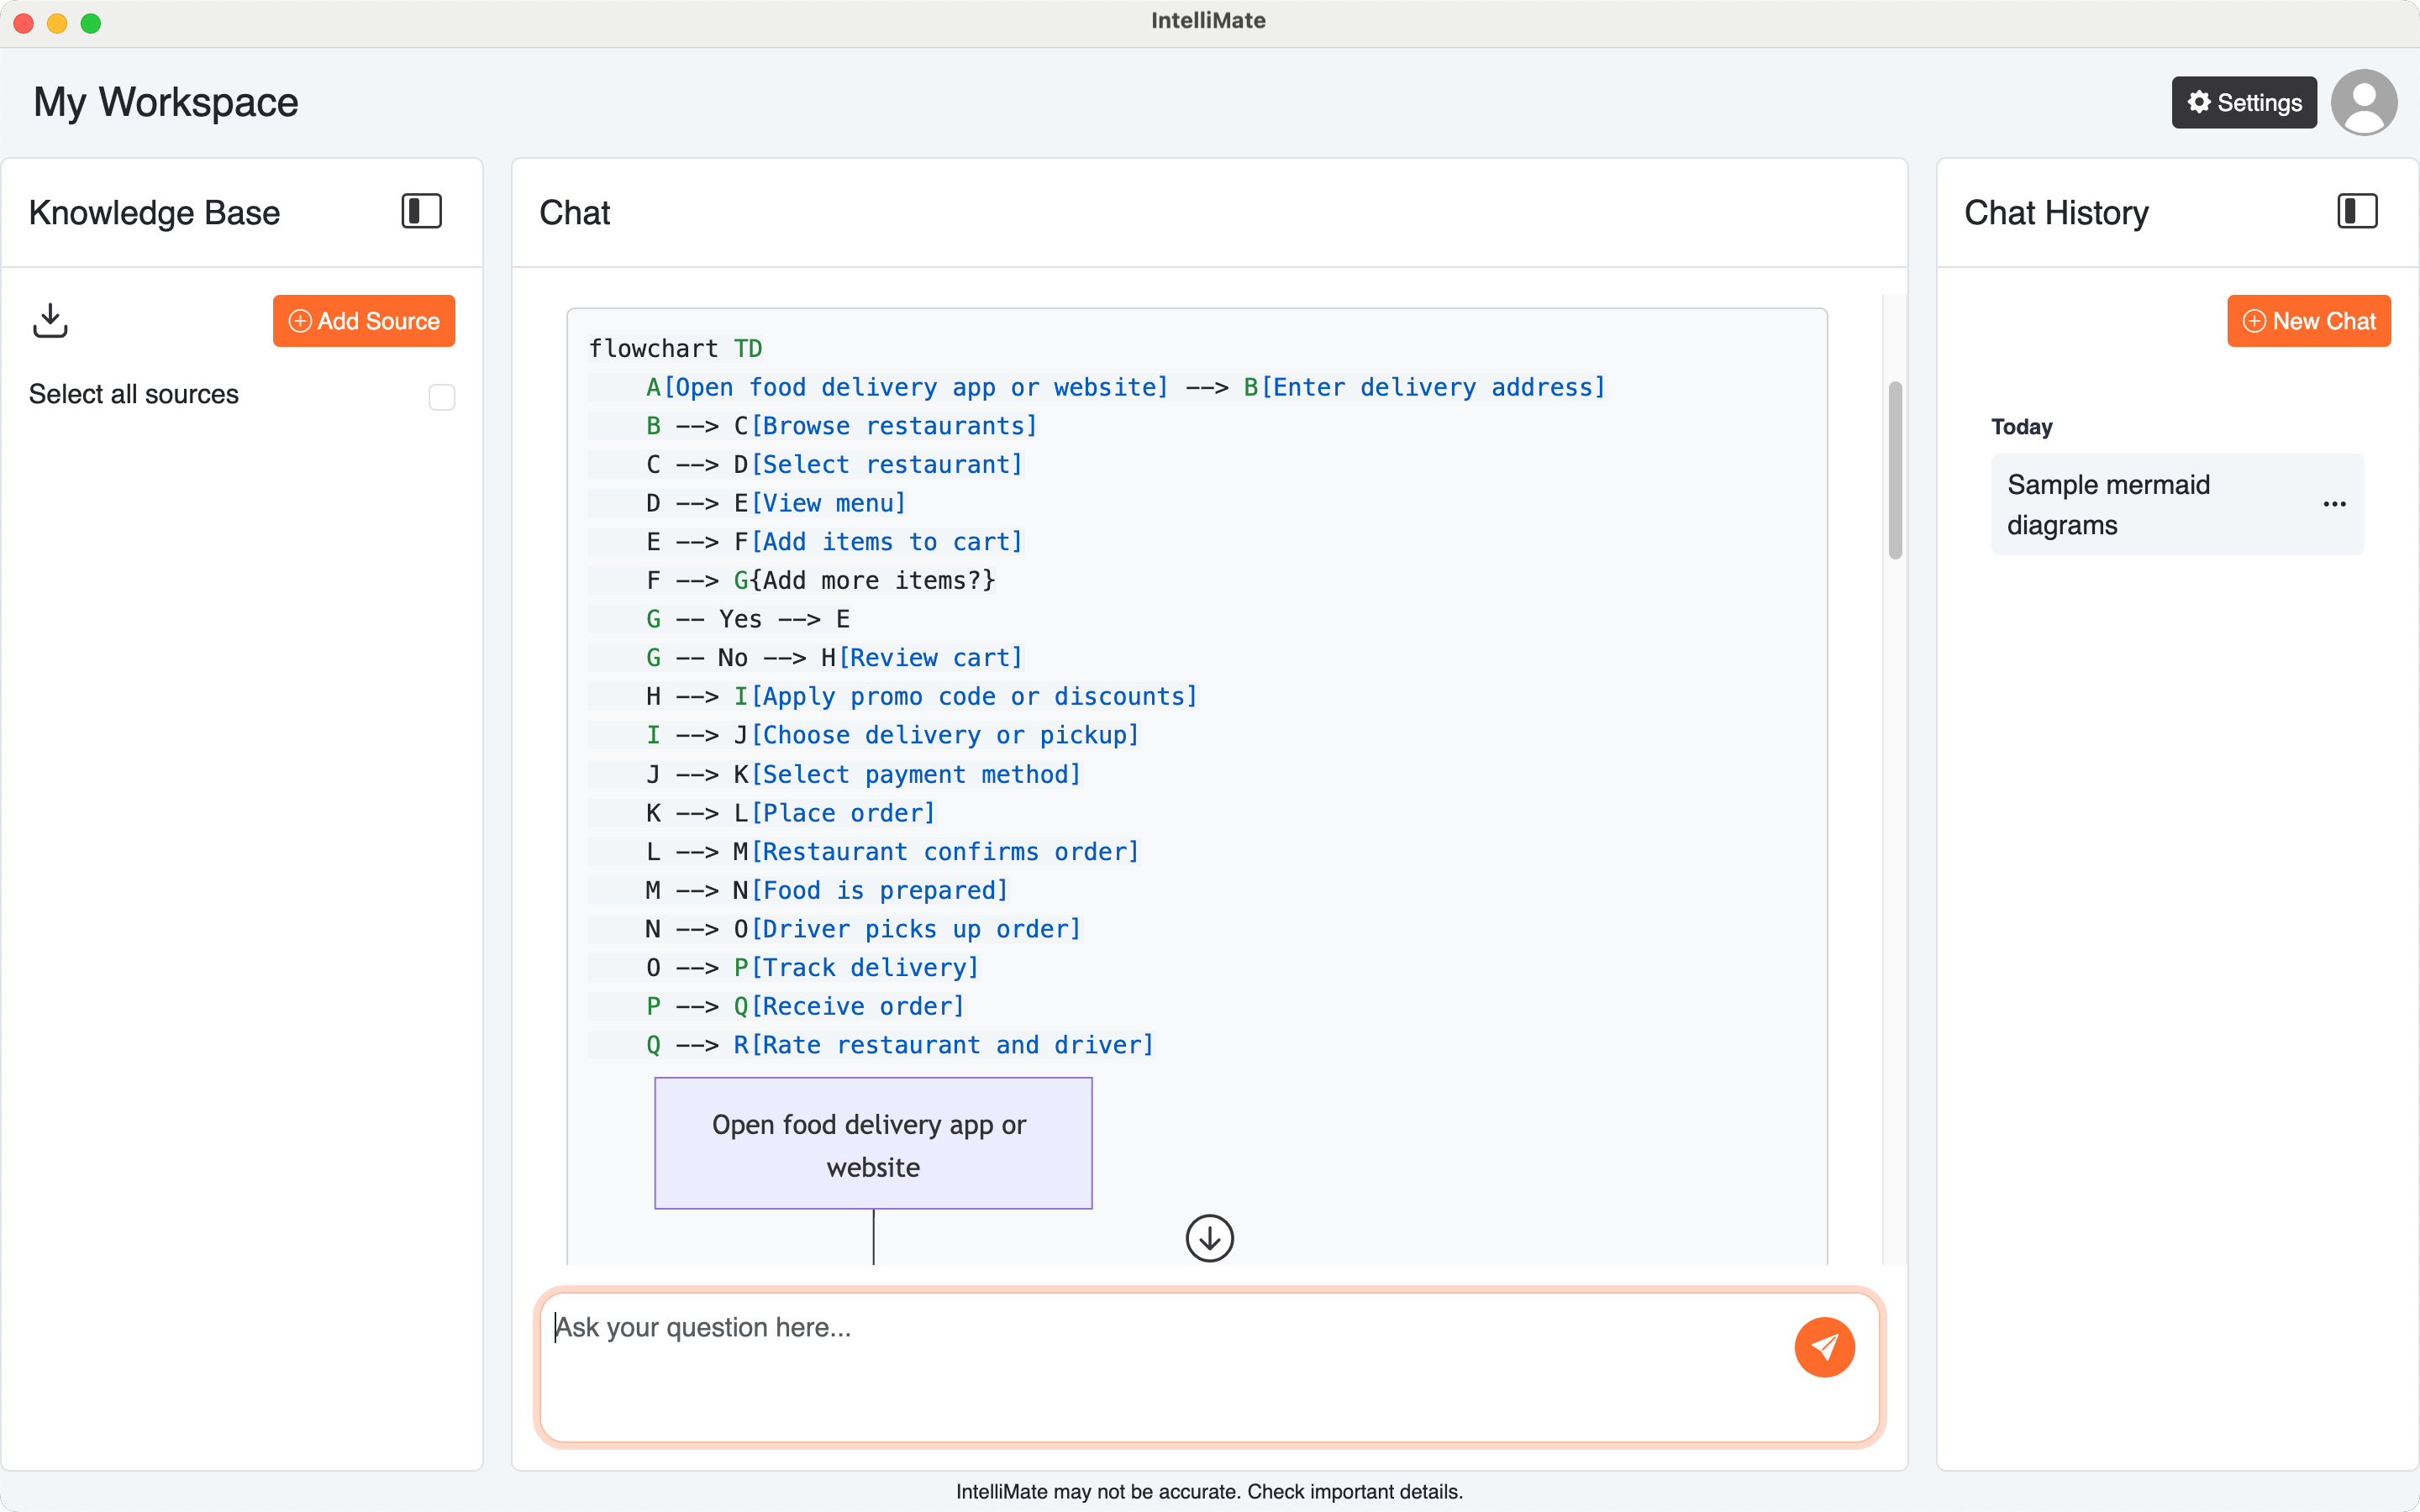
- Flowcharts: process flows, user journeys, decision trees, approval flows, and step-by-step workflows
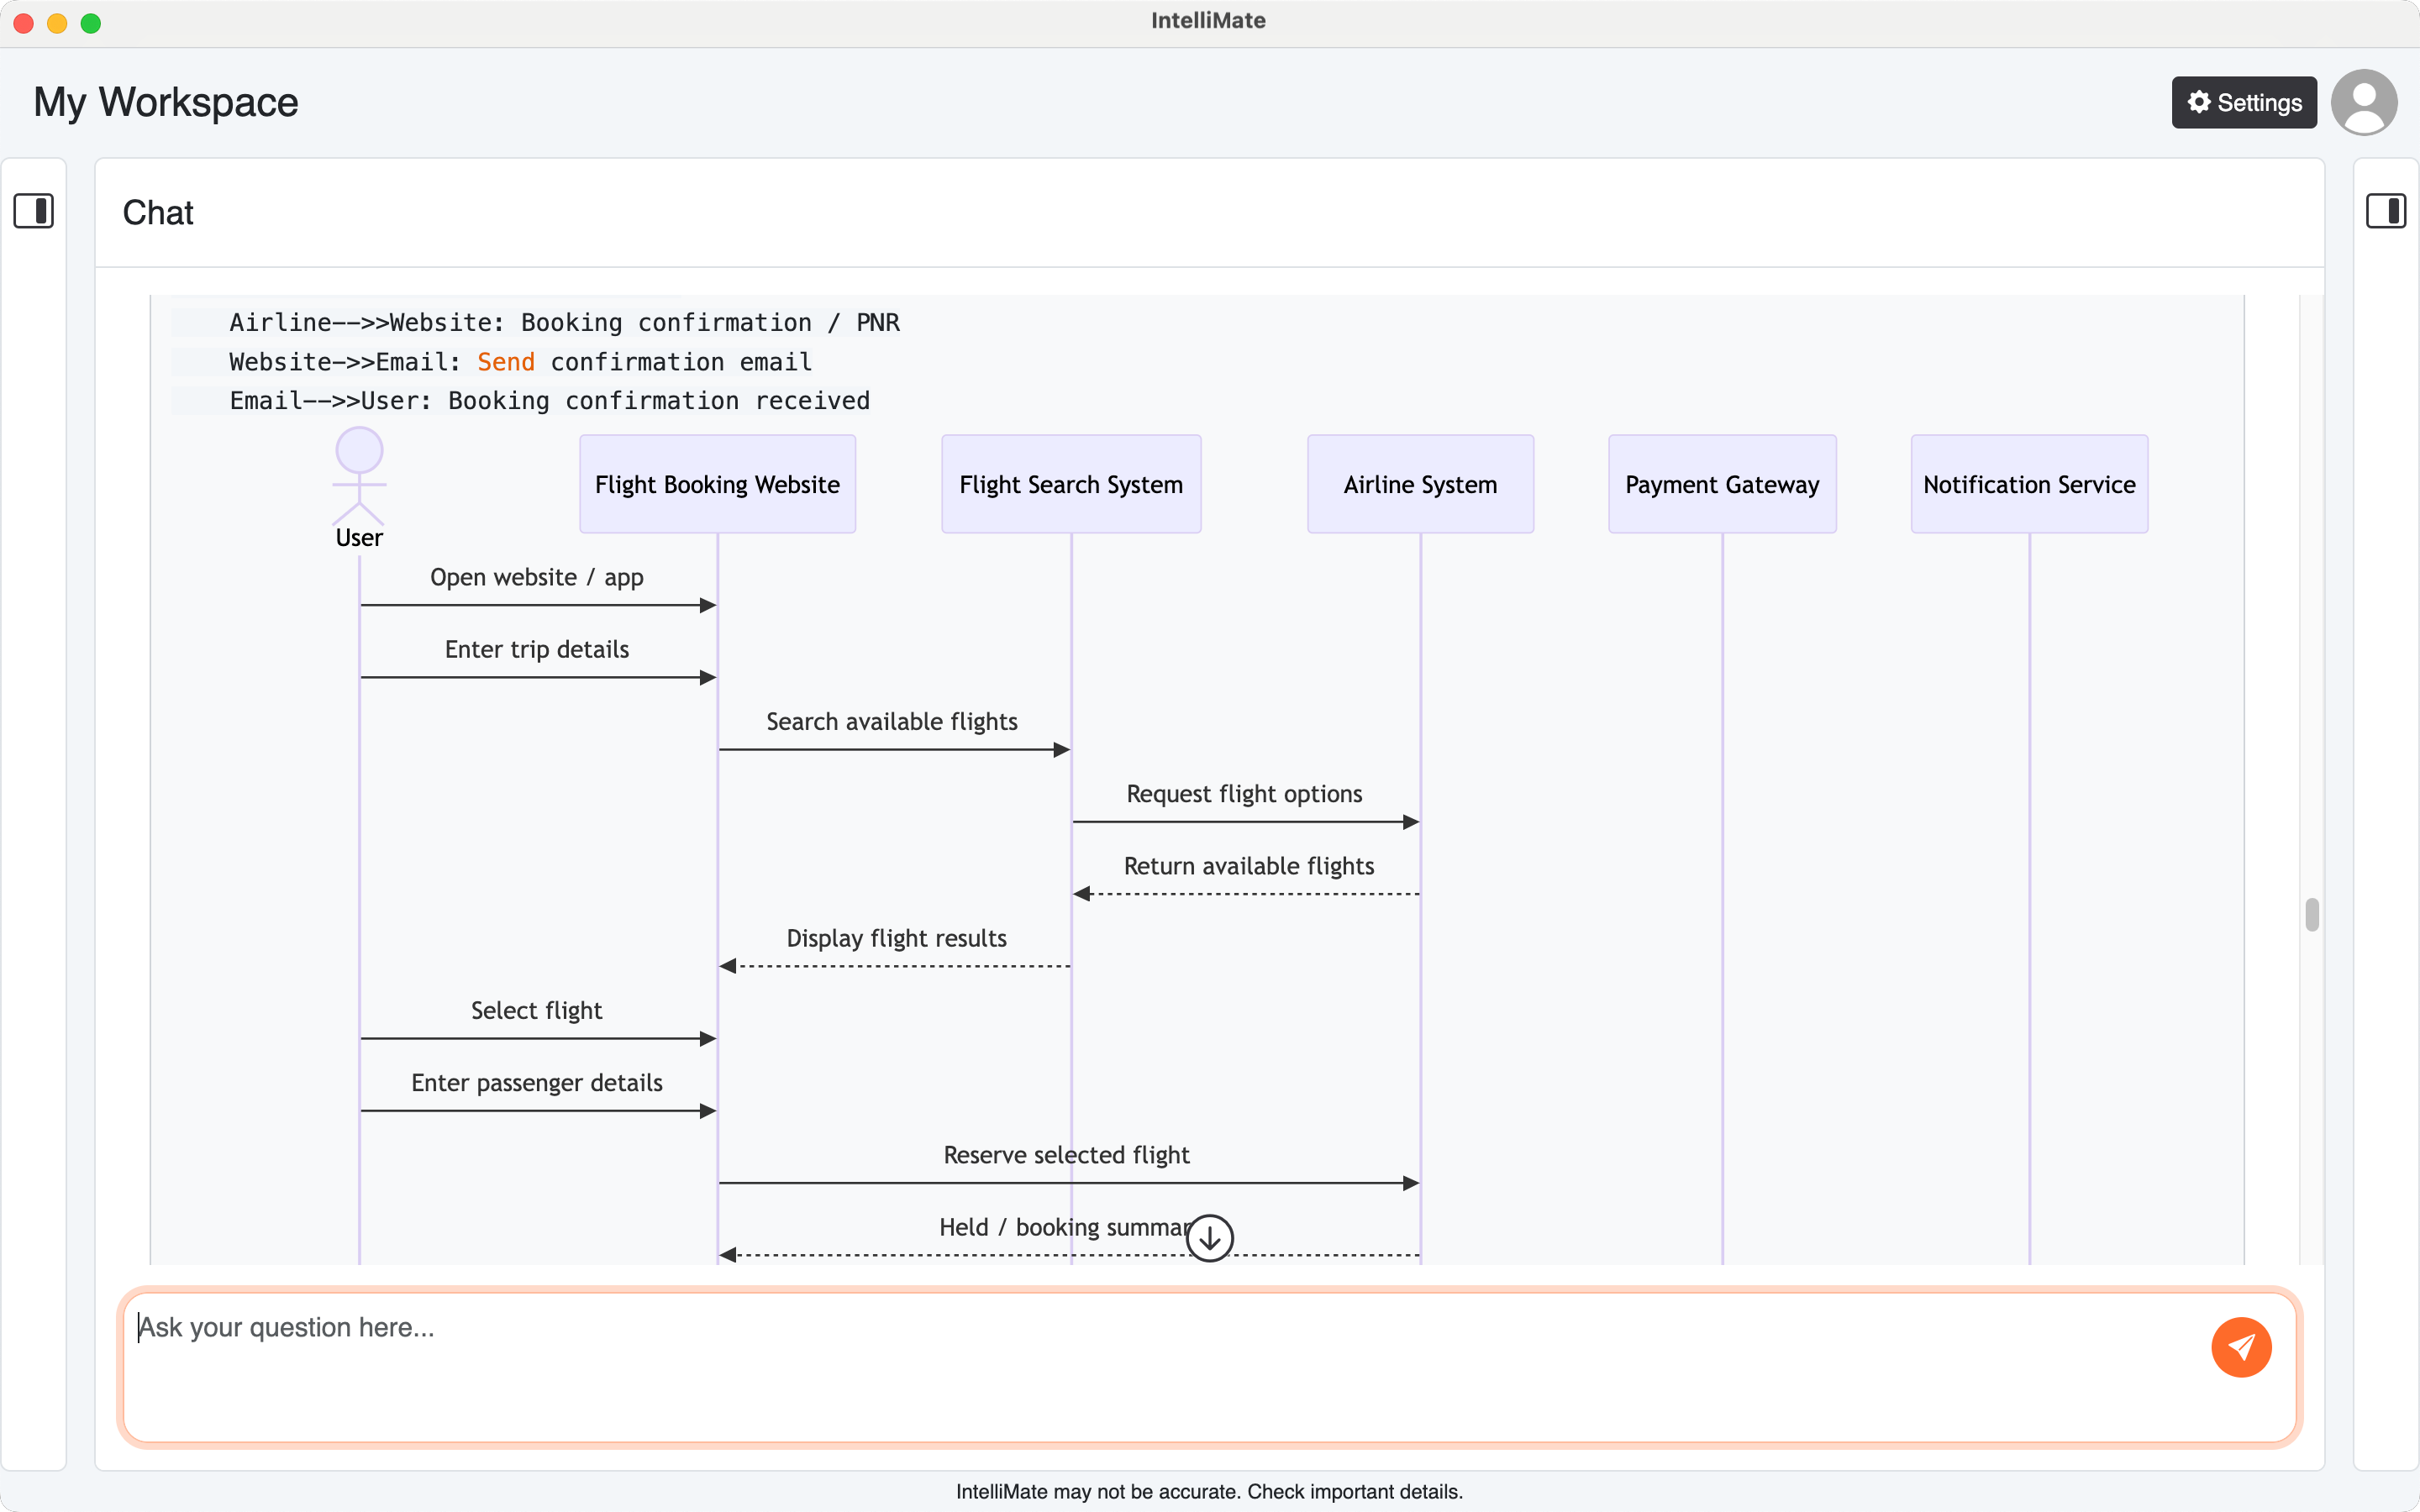
- Sequence diagrams: interactions between people, apps, services, and systems over time
- Class diagrams: object structure and relationships in software or system design
- State diagrams: status changes, lifecycles, and transitions between states
- Entity relationship diagrams: entities and relationships in a database or structured data model
- User journey diagrams: stages, actions, and experience flows from a user perspective
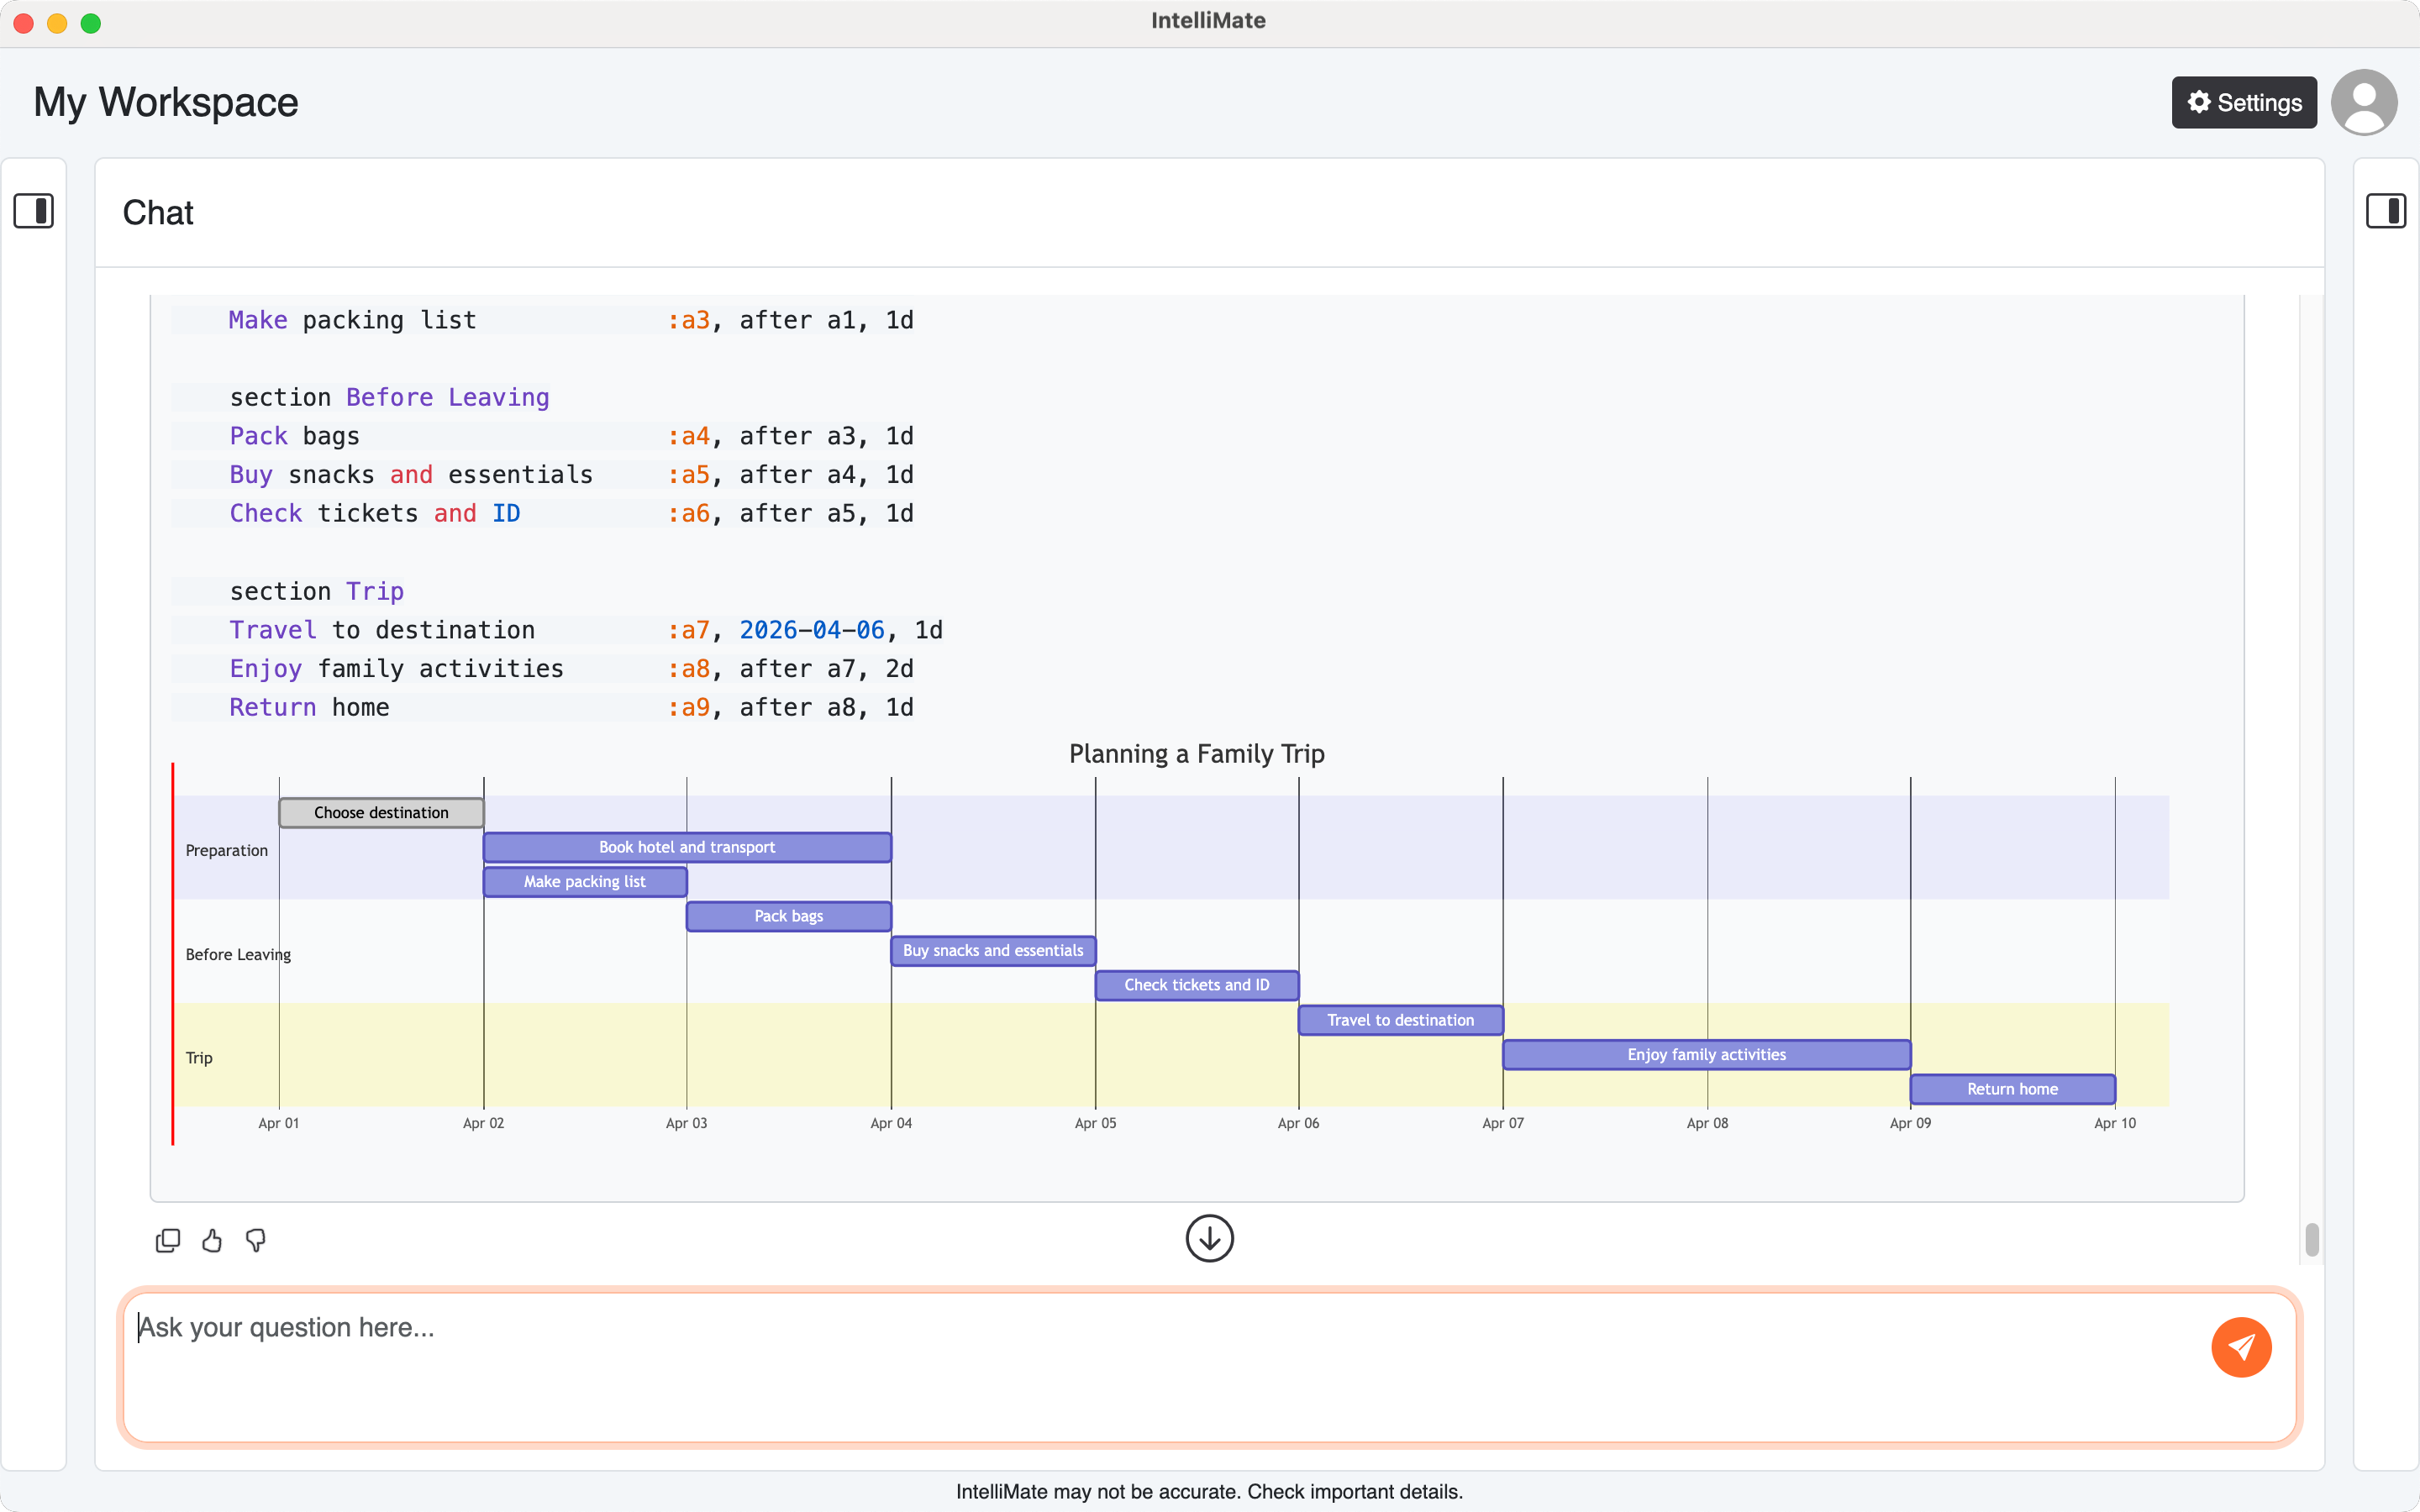
- Gantt charts: schedules, milestones, project phases, and planned tasks
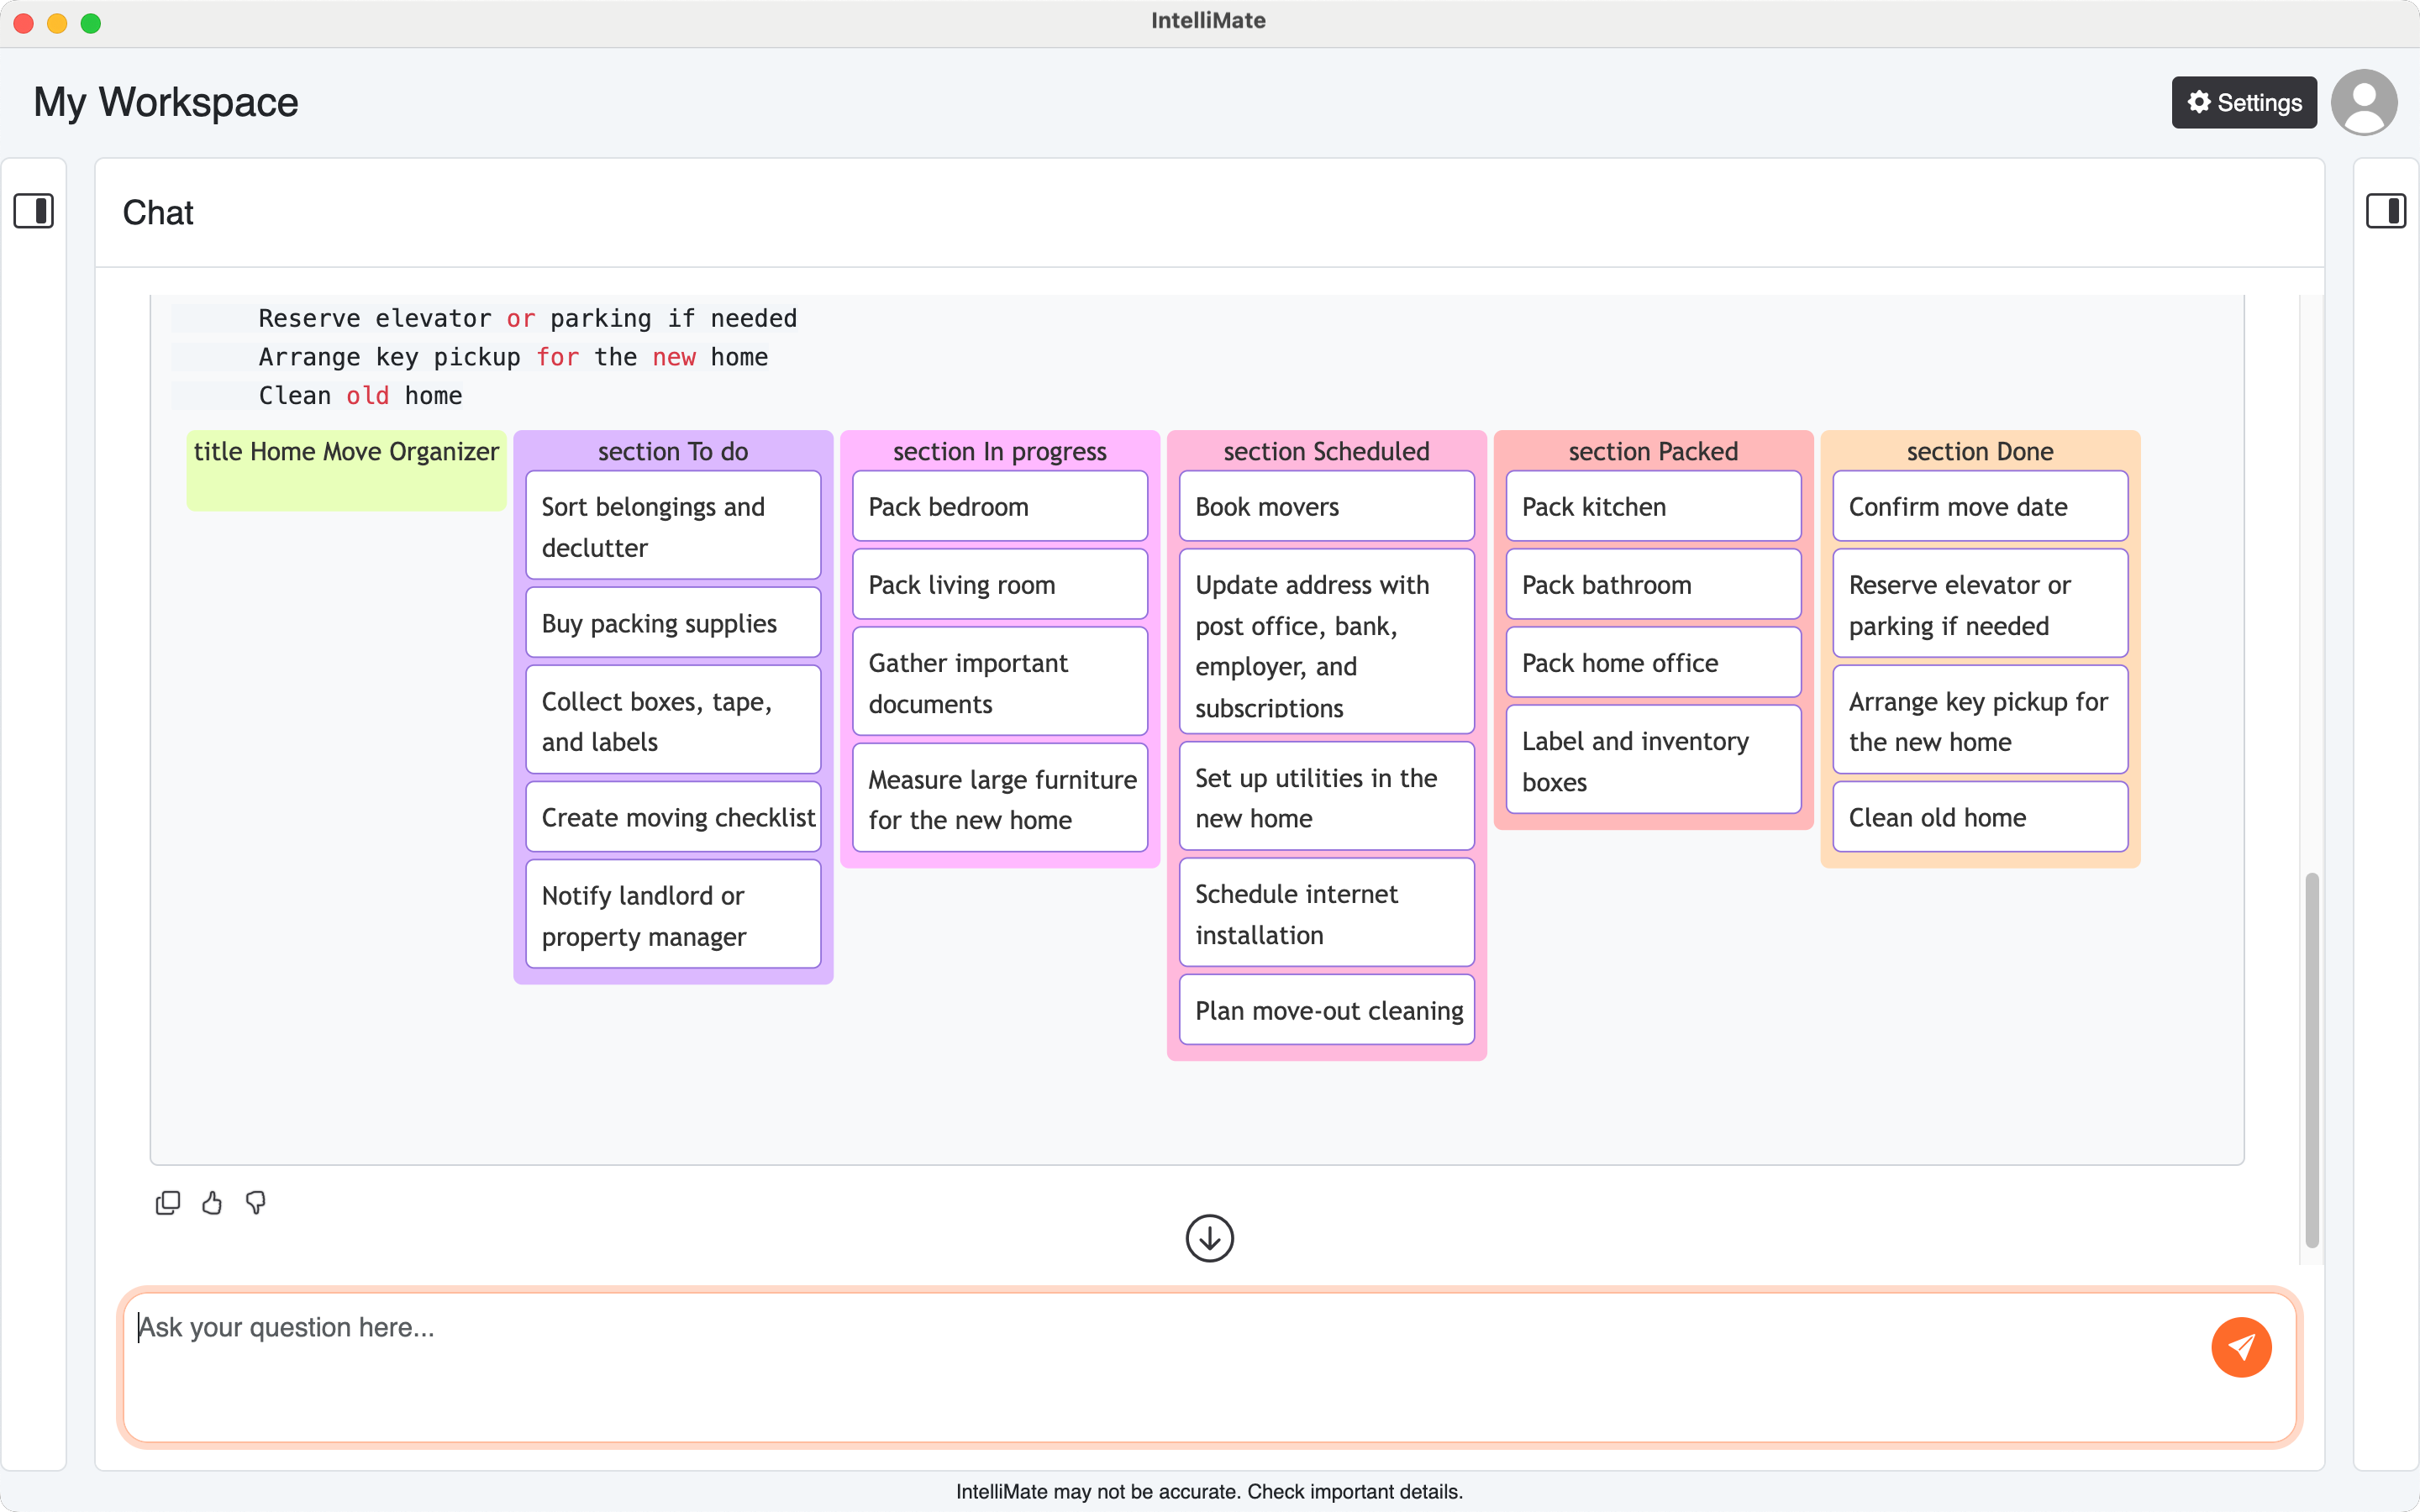
- Kanban diagrams: task boards showing what is to do, in progress, and done
- Pie charts: simple category breakdowns
- Quadrant charts: comparisons across four areas
- Mind maps: idea grouping and topic expansion
- Timeline diagrams: events arranged over time
- Git graphs: branch and merge history
- Block diagrams: major parts of a system and how they connect
- Architecture diagrams: system structure and component relationships
The most common ones for everyday use are usually mind maps, flowcharts, and sequence diagrams.
4. When you may see diagrams
You may see a diagram in IntelliMate when you ask for:
- step-by-step workflows
- decision paths
- interactions between people or systems
- timelines or schedules
- main ideas and how they connect
- plans, stages, or structured relationships
In many cases, IntelliMate will show the diagram directly in the response so it is easy to review.
5. Example prompts you can try
Here are some example prompts you can use in IntelliMate to generate popular diagrams using familiar everyday topics.
Flowchart examples
- Draw a flowchart for ordering food delivery online.
- Create a flowchart for an online shopping checkout process.
- Show a decision flowchart for choosing a university course.
- Draw a flowchart for how a customer returns a product.
Sequence diagram examples
- Draw a sequence diagram for booking a flight online.
- Show a sequence diagram for placing an order in a food delivery app.
- Draw a sequence diagram for booking a hotel room online.
Other simple examples
- Create a Gantt chart for planning a family trip with sections for Preparation, Before Leaving, and Trip. Include realistic tasks and durations, and return only the diagram.
- Create a Kanban diagram for organizing a home move, with columns such as To do, In progress, Scheduled, Packed, and Done. Include common tasks like sorting belongings, buying packing supplies, booking movers, updating the address, packing each room, cleaning the old home, and setting up utilities in the new home.
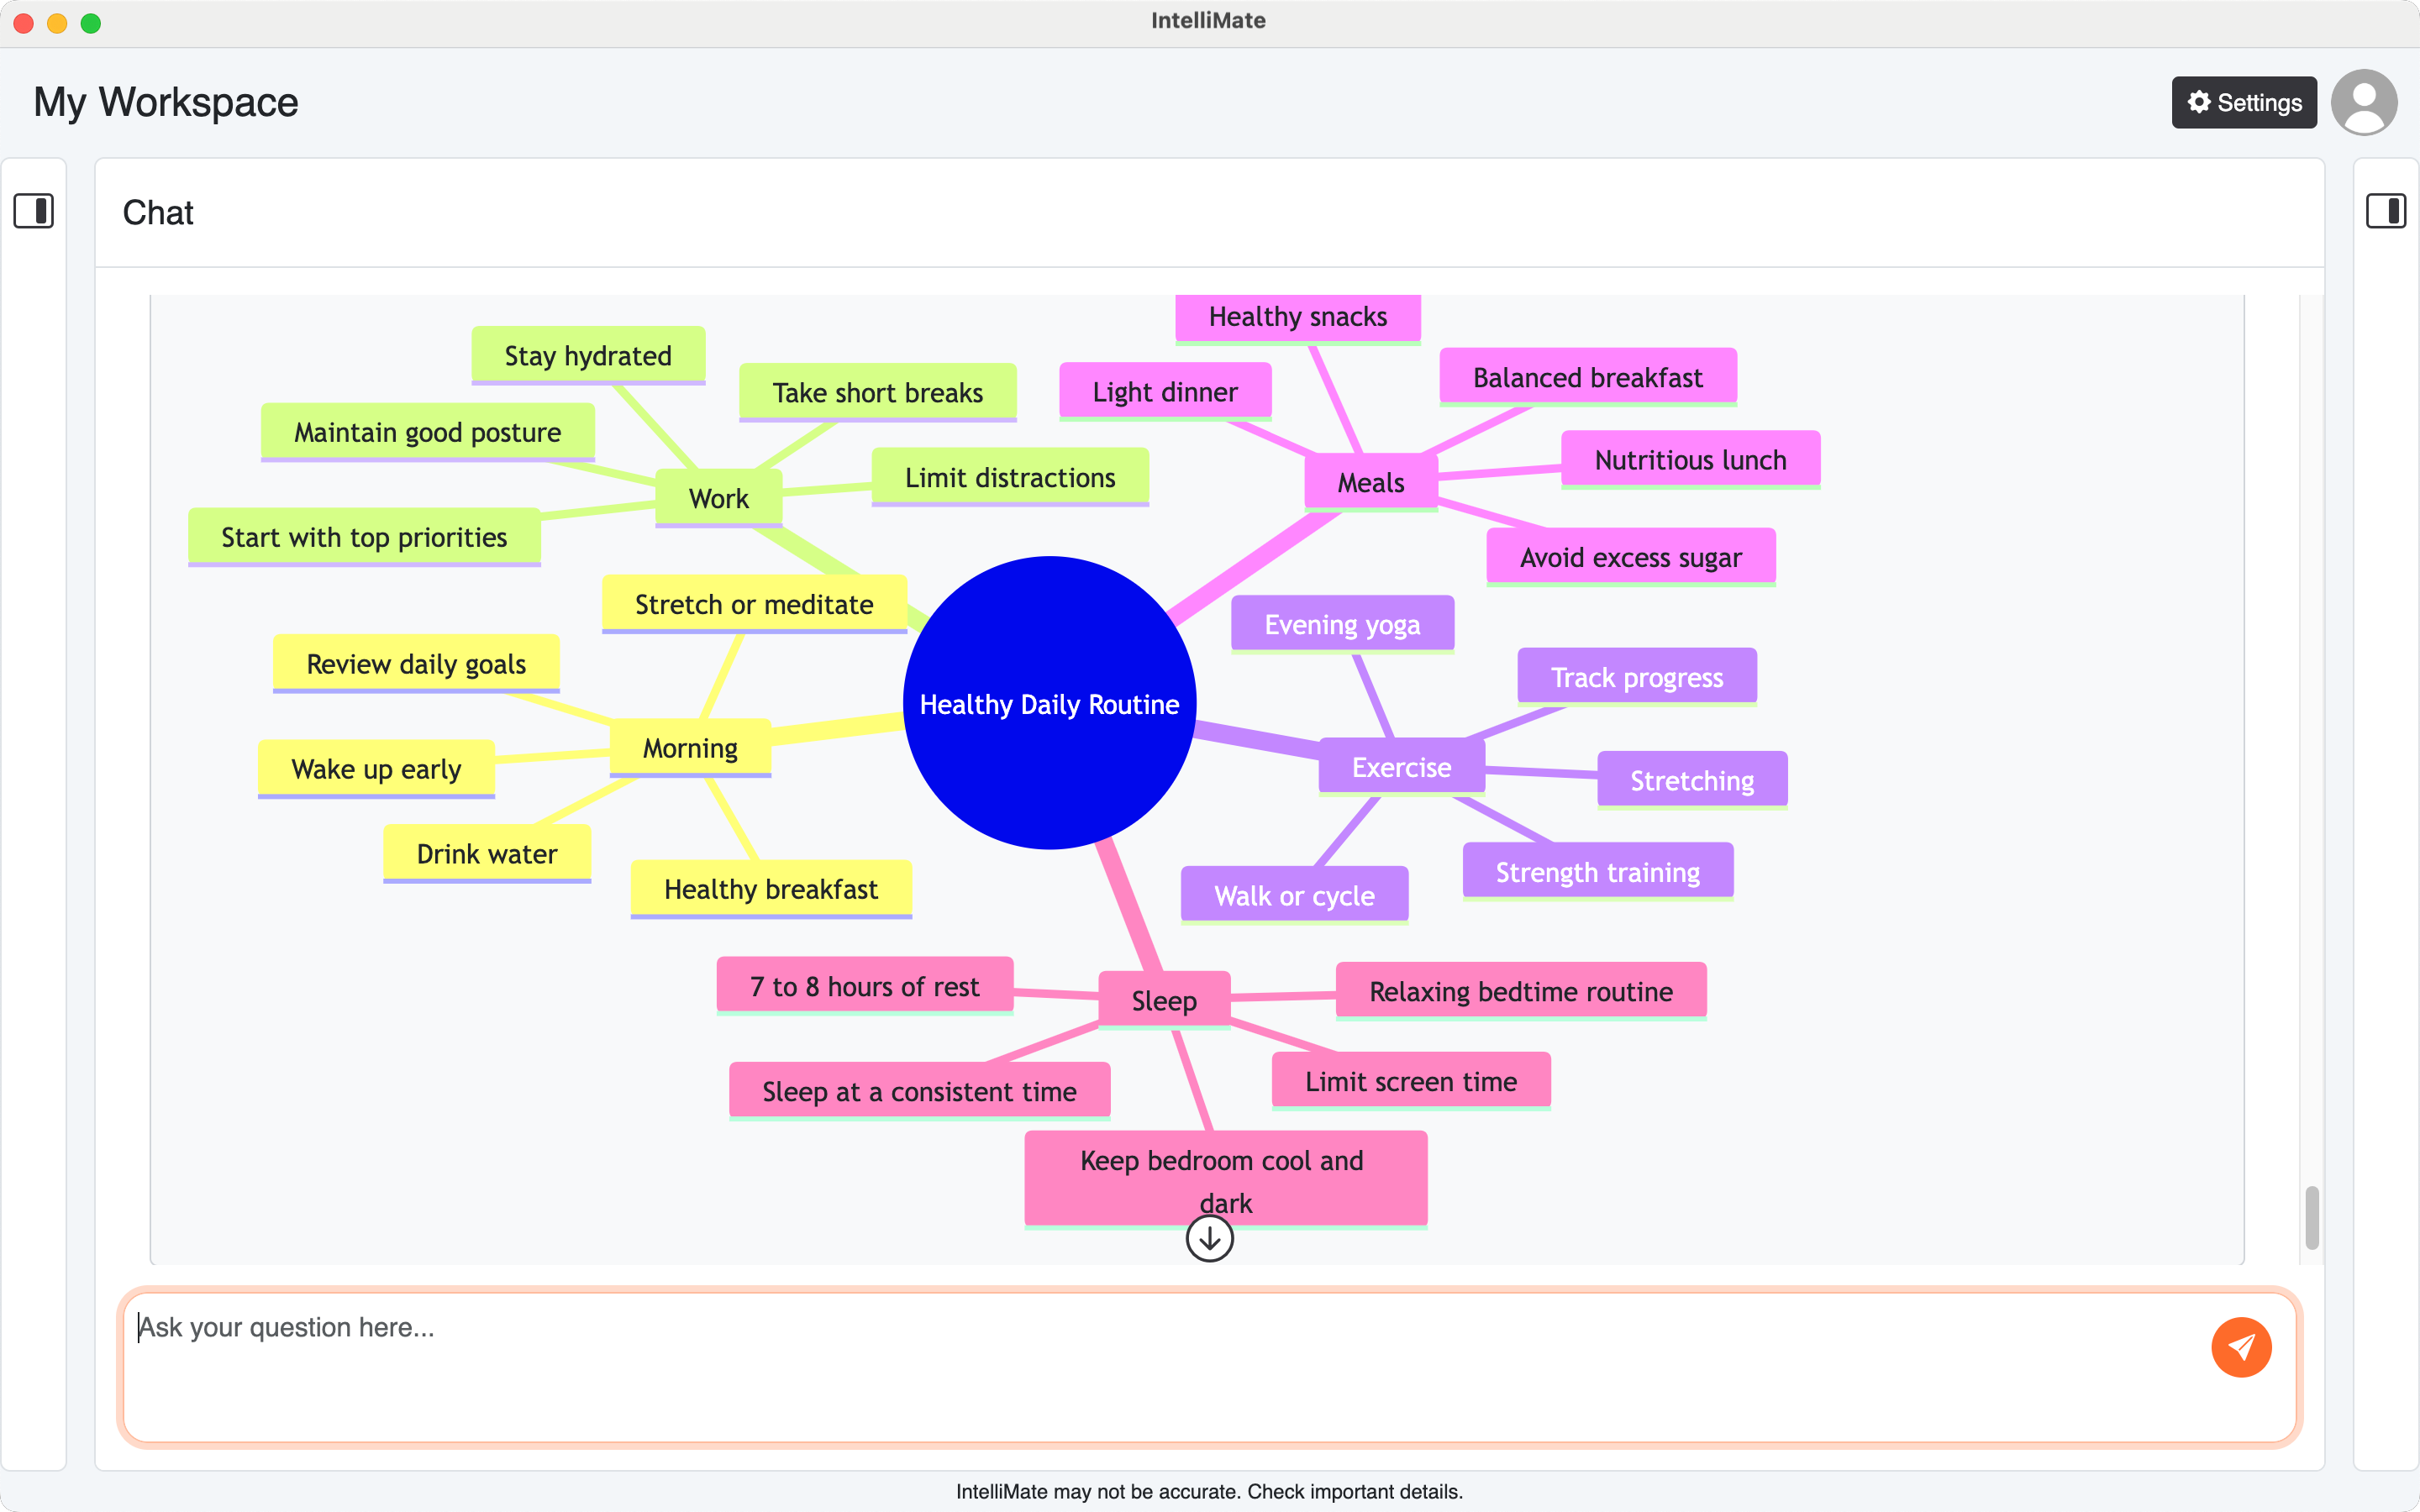
- Create a mind map for planning a healthy daily routine, with branches for morning, work, exercise, meals, and sleep.
- Create a timeline for a product launch.
- Draw a user journey for buying movie tickets online.
- Show an ER diagram for a simple library database.
6. Why this is useful
Diagrams can make AI responses easier to understand when IntelliMate:
- explains a process visually instead of only in paragraphs
- shows how people, systems, or ideas connect
- helps you plan a workflow, project, or structure
- turns abstract ideas into something easier to review
This can be useful for both technical and non-technical users who prefer visual explanations.
7. Tips for better diagram results
- Ask clearly for a diagram when a visual explanation would help
- Name the kind of diagram you want, such as a flowchart, timeline, or mind map
- Describe the key steps, stages, or ideas clearly
- Start simple, then ask IntelliMate to refine or expand the diagram
For more on how IntelliMate displays AI output, see AI responses.